Thursday, 11 May 2017
WTI Crude Oil - Shale Drillers Are Outspending the World With $84 Billion Spree
U.S. shale explorers are boosting drilling budgets 10 times faster than the rest of the world to harvest fields that register fat profits even with the recent drop in oil prices.
That’s bad news for OPEC and its partners in a global campaign to crimp supplies and elevate prices.
Shale drillers can afford to be sanguine despite oil's recent tumble because they've cushioned themselves with hedges.
More news, Shale Drillers Are Outspending the World With $84 Billion Spree
Will the price decline continues with drilling boost ?
What the price chart shows - more decline or reversal ?
Daily chart of West Texas Intermediate (WTI) Crude Oil.
As noted in the previous update post dated 8 May, Observed the 2 set of dates, 4 & 5 May and 8 & 9 March, massive volume transacted and absolute volume is quite close.
Our previous support zone, between $47.01 and $47.70, now acts as the immediate resistance zone. Yesterday, the price briefly broke above the $47.70 upper channel of the zone before closing at $47.33.
Latest S-Trader Trend Tracker daily resistance levels.
Resistance1 = $51.38
Resistance2 = $49.18
Immediate focus on price action towards the resistance zone.
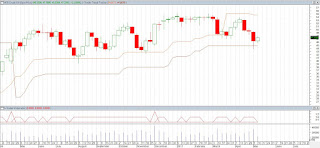
Here is the weekly chart.
In the post dated 8 May, a question was raised.
Will the weekly Trend Tracker Support level able to hold the price from further slide ?
To date, the weekly levels identified using S-Trader Trend Tracker still remains.
Resistance = $54.62
Support = $44.81
If the price breaks below the weekly support level, there is a possibilities of more price decline.
Source :
1) Metastock
2) www.bloomberg.com
Subscribe to:
Post Comments (Atom)


No comments:
Post a Comment