In our previous post dated on 16 May, Air China stock was highlighted whether the rally is around corner.
A resistance zone formed way back to 2014/2015 came into play again. Last few weeks the price action has been trading side way within the resistance zone.
Weekly chart of Air China Ltd.
Last Friday (week ending 26 May), the price broke out the resistance zone.
However, the relatively below average volume associated with the price action.
But, on the daily chart observed relatively high volume supported the price action on 26 May as shown below.
Daily chart of Air China Ltd.
Note : S-Trader indicators/tools is not part of Metastock software package. It is our proprietary system/tools. If you have any further inquiries, please feel free to Contact Us.
Source :
1) Metastock
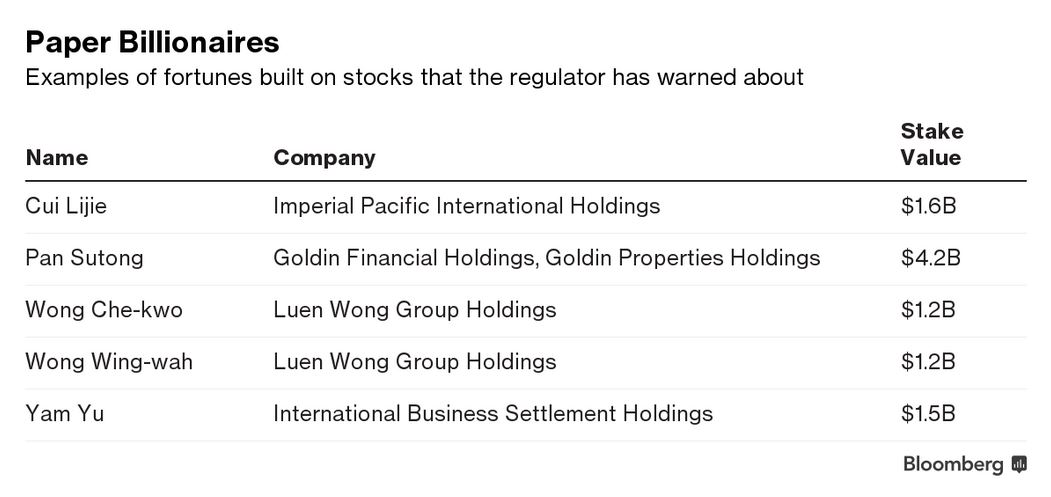
In the Bloomberg news article dated on 18 April 2017, it shared some shares of all the paper billionaires' companies have traded between 5 and 335 times their respective book values. Hong Kong companies ranged between 1 and 1.3 last year.
One of the stocks listed above, Goldin Financial Holdings Ltd. (HKSE - 0530.HK) owned by Pan Sutong, who was formerly the 4th richest person in Asia, according to the Bloomberg Billionaires Index. His companies was issued with the SFC's warning in 2015.
Here is a look at the daily chart of Goldin Financial Holdings Ltd showing the rally before the massive crash in May 2015.
(Note : The dates highlighted on the chart below has some typo error. It should be 20 and 21 May 2015 instead of 2016)
Another view on daily chart of Goldin Financial Holdings Ltd. showing the some best entry level based on S-Trader system before the strong rally.
On 15 Sept 2014, the price broke out its sideway with relatively high volume - 6,462,320 traded. It rallied to high of HKD6.71 on 24 Sept before it pullback and traded sideway until Dec.
The other best entry level occurred on 15 Dec 2014. The price broke out ranging market with relatively high volume on that day - 5,806,743 traded.
Throughout this period, S-Trader Trend Tracker held steadily and was only tested once on 7 Nov 2014 but did not break below it.
Source :
1) www.bloomberg.com (A 9,800% Stock Increase Exposes Hong Kong's Billionaires on Paper)
2) Metastock
Daily chart of West Texas Intermediate (WTI) Crude Oil.
S-Trader Trend Tracker daily support levels.
Support1 = $ 48.39
Support2 = $ 46.61
S-Trader Trend Tracker weekly support and resistance levels.
Support = $ 44.81
Resistance = $ 54.62
The above mentioned levels still remain intact.
Source :
1) Metastock
Last night, OPEC and its allies extended oil production cuts for 9 more months after last year's landmark agreement failed to eliminate the global oversupply or achieve a sustained price recovery.
The producer group together with Russia and other non-members agreed to prolong their accord through March, but no new non-OPEC countires will be joining the pact and there was no option set out to continue curbs further into 2018.
More news, OPEC, Allies to Extend Oil Cuts for Nine Months to End Glut
Unfortunately, the market reacted negatively to it. The price fell and closed at $48.90 with relatively high volume transacted - 1,139,346.
Daily chart of West Texas Intermediate (WTI) Crude Oil.
From the chart, notice the previous 2 wide range bar (circled in blue colour) that occurred on 8 March and 19 April. The price action associated with above average /or high volume on both occasions right before it broke the S-Trader Trend Tracker support level.
This time a similar situation happened last night but much bigger volume traded.
S-Trader Trend Tracker support levels (Daily chart)
Support1 = $ 48.39
Support2 = $ 46.61
Will the support levels and zone able to hold the price decline ?
Also, take note on both events the price fell further followed by a rebound forming series of Lower Low and Lower High.
Is a new low in the making ?
Source :
1) Metastock
2) www.bloomberg.com
Daily chart of West Texas Intermediate (WTI) Crude Oil.
Finally, it pushed thru' the final daily S-Trader Trend Tracker resistance level on 23 May and closed at $51.47 with slightly below average volume.
Yesterday's volume came in stronger than the last 2 days but the price action failed to close above its intraday mid-point. Yet to see strong market participation for uptrend movement.
Look for strong volume and price action to continue its upward momentum.
Source :
1) Metastock
Recalled the chart below, posted on 8 May.
Indeed, the price rebounded following the massive volume transacted on 4 & 5 May reflecting the similar action happened on 8 & 9 Mar. Only the last set of dates (8 & 9 Mar) took more days to react than the former.
It successfully broke all resistance levels with only S-Trader Trend Tracker resistance level remain on daily chart at $51.38.
Daily chart of West Texas Intermediate (WTI) Crude Oil.
Last night, the price recorded its day high of $51.43 which briefly broke the $51.38 resistance level before settling at $51.13 during market closed.
The volume transacted associated with the price action slightly below average with the total amount of 561,671.
However, yesterday's price action and volume showed there is a possibility lack of demand from the market to break thru' the resistance.
Going forward, watch for strong volume and price action to overcome this resistance level.
Source :
1) Metastock
The Hong Kong Stock Exchange and its sibling, the Growth Enterprise Market, have become a breeding ground for paper billionaires.
In the past three years alone, perhaps as many as a dozen executives, many from mainland China, have amassed billion-plus wealth as their companies’ share prices soared, usually for no apparent reason.
The executives and their companies haven’t been accused of wrongdoing.
But the phenomenon has raised flags for Hong Kong regulators, who warn that the stocks can be susceptible to manipulation, particularly when few of the shares are in the public’s hands.
More news, A 9,800% Stock Increase Exposes Hong Kong's Billionaires on Paper
Source :
1) www.bloomberg.com
Daily chart of West Texas Intermediate (WTI) Crude Oil.
Last night it broke 3 resistance levels closing at $49.66.
There are as follows :
a) S-Trader Trend Tracker daily resistance2 = $49.18
b) 50-period simple moving average (SMA) = $49.38 (yesterday's closing)
c) 200-period simple moving average (SMA) = $49.37 (yesterday's closing)
However, the volume associated with the breakout relatively low compare to 15 and 17 May.
An interesting episode to watch going forward.
Source :
1) Metastock
In the post dated on 11 May, the weekly chart of Credit Acceptance Corp showed the company share price has been trading side way since October 2015.
Daily chart of Credit Acceptance Corp.
The share price gapped up on 2 May with relatively very high volume. Thereafter, trending side way below $219.33 (2 May closing price) supported by relatively very low volume.
Weekly Chart.
From weekly chart, S-Trader Trend Tracker resistance level at $223.06 a great barrier for the share price to move higher.
Since Dec 2016, the share price attempted several to break above the resistance but unsuccessful.
Week ending 5 May, the share price tried to rally with relatively high volume which, comparatively higher than those price action between week ending 9 Dec 2016 and 6 Jan 2017. Despite that, it still failed.
Is the smart money losing their faith on this company ?
Only a positive catalyst able to push thru' the resistance level.
Weekly S-Trader Trend Tracker levels.
Resistance = $223.06
Support = $186.90
Source :
1) Metastock
Daily chart of West Texas Intermediate (WTI) Crude Oil.
S-Trader Trend Tracker daily resistance levels still remains.
Resistance1 = $51.38
Resistance2 = $49.18
Based on yesterday's closing price,
50-period simple moving average (SMA) = $49.56
200-period simple moving average (SMA) = $49.24
Looking at the chart. There are several resistance ahead for the price action to clear before a sustainable bull could takes charge.
Will it has the strength to overcome ?
Source :
1) Metastock
Last weekend, Bloomberg reported U.S. drillers have dramatically reduced their hedging activity, a move that could portend a break in the production gains that
have upended global crude prices.
The relative cost of options protecting against a drop in West Texas Intermediate crude has fallen to its lowest since August, thanks to a big drop in producer hedging.
Hedging contracts lock in payments for future production. U.S. drillers
signed onto such agreements in droves late last year, after an OPEC-led
deal to cut output raised prices. The Catch-22 is that the guarantees
gave drillers the security to boost output, undercutting the rally. Now,
futures have languished to the point that the industry’s favorite
financial safeguard no longer makes economic sense.
More news, U.S. Shale's Favorite Financial Trick Is Getting Less Attractive
Source :
1) www.bloomberg.com
Daily chart of Jollibee Food Corp.
S-Trader Trend Tracker support levels on 12 May.
Support1 = 209.71 Peso
Support2 = 204.23 Peso
On 15 May, the share price closed below the Trend Tracker Support1 level (209.71 Peso), at 206 Peso,
Source :
1) Metastock